How are EPR fees set, and how do fee levels compare across jurisdictions?
EPR fees are the system's central price, and they are set by a process that surprises most newcomers: not by reference to environmental damage, and not by a market, but by dividing a budget. This article explains how fee-setting actually works; presents the verified fee schedules across ten jurisdictions as of 2025–26; documents the extraordinary spreads the comparison reveals — European plastics fees alone vary more than twenty-fold — and reviews what the comparative studies say about why fees differ and whether the differences matter. The recurring caution throughout is that fee comparisons are scope comparisons in disguise: a low fee that funds part of a system and a high fee that funds all of one are not the same price.
1. How fees are actually set
Nearly every packaging fee in the world is produced by the same arithmetic: the system's budgeted net cost, allocated across materials, divided by reported tonnage. The producer responsibility organisation forecasts what collection, sorting and processing will cost, nets off expected material revenue, attributes the result to material categories, and divides by each category's expected supply. The output is a per-tonne (or per-kilogram) rate schedule, typically adjusted by eco-modulation bonuses and penalties, and often supplemented by per-unit elements and sector multipliers — France's Citeo, for instance, layers per-unit and per-kilogram components with escalating penalty multipliers and sector coefficients.
Three properties follow from this construction, each developed elsewhere in this library. Fees are cost-based, not damage-based — no schedule anywhere prices marginal environmental harm (the economic foundations). Fees are interdependent across materials — the attribution of shared costs (the same truck carries everything) is a modelling choice that redistributes millions between material sectors, and it is generally unpublished (the transparency article). And fees are residuals — when tonnage forecasts, commodity prices or program budgets move, the fee moves to balance, which is why year-on-year jumps (Quebec's aluminium rate; the multi-fold increases Ontario producers reported through transition) tell you about the system's cost base, not about any material's environmental performance.
Who performs the arithmetic varies more than the arithmetic itself. In most jurisdictions the producer organisation sets fees subject to regulatory approval or none; the United Kingdom is the structural outlier — the state scheme administrator, PackUK, sets fees itself, which is why the UK is also the jurisdiction that publishes its methodology (the capacity article).
On top of the base arithmetic sits the modulation layer, which varies enormously in ambition. France's Citeo runs the most elaborate structure: per-unit plus per-kilogram components, bonuses reaching 15–20%, penalty multipliers escalating from 10% to 50% to 100% over three years for unaddressed design problems, and sector coefficients that scale the whole tariff by market segment (from 100% for fresh goods to 152% for beverages in the 2025 structure, as reported by French compliance analysts). Belgium prices recyclability through category granularity itself — nineteen-odd plastic subcategories, with a flat €4.419/kg rate for non-recyclable categories, roughly twelve times the clear-PET rate. The Netherlands runs a recyclate discount (raised to €0.20/kg for 2025) rewarding recycled content directly. Whether any of this changes design is Theme 5's question; what it certainly changes is the fee dispersion documented below.
One more feature of the arithmetic deserves notice: fees have been rising nearly everywhere, for reasons the budget logic makes transparent. As coverage obligations expand toward full net cost, as collection scope grows, and as sorting infrastructure is built, the budget grows and the fee follows: French plastic-bottle rates rose 30–40% in 2025 alone (reported); German brokerage rates are up over 40% since 2020 (reported, broker source); Fost Plus attributes its 2026 increases to rising collection and sorting costs and contract renewals; and Ontario producers described fee multiples of four to six times pre-transition levels. The aggregate sums are now substantial: roughly £1.46 billion collected in the UK's first year, Can$457 million in Quebec's, an expected ~US$190 million rising toward $300 million in Oregon's first years, and over €1 billion annually in France.
2. The rates: verified schedules, 2025–26
The table below assembles rates from primary fee schedules examined for this library in August 2026, converted to a common per-tonne basis for three reference materials. Native units and scope caveats follow the table, and matter.
| Jurisdiction (source year) | Clear PET bottles | Aluminium containers | Paper/board |
|---|---|---|---|
| Belgium (Fost Plus 2026) | €360/t | €49/t | €150/t |
| Netherlands (Verpact 2026) | €1,220/t (rigid plastics) | €340/t | €17/t |
| UK (PackUK 2025–26 base) | £423/t (all plastic) | £266/t | £196/t |
| France (Citeo 2026, reported) | ~€399/t | ~€432/t | ~€177–217/t |
| Quebec (ÉEQ 2026) | C$1,006/t | C$445/t | C$540–713/t |
| Colorado (CAA 2026) | US$331/t (15¢/lb) | US$44/t (2¢/lb) | US$176/t (corrugated) |
| Oregon (CAA 2026, reported) | ~US$551/t (25¢/lb) | ~US$132/t | ~US$110–176/t |
| California (CAA illustrative, May 2026) | US$243–838/t (11–38¢/lb, scenario range) | US$88–265/t | US$22–705/t |
Selected native-unit detail from the verified schedules: Belgium's Fost Plus prices nineteen-odd plastic subcategories, from clear colourless PET at €0.3604/kg through PP films at €2.2095/kg to a flat €4.419/kg for non-recyclable categories; the Netherlands runs the widest single-schedule spread in Europe — paper at €0.017/kg against flexible plastics at €1.32/kg, a 78-fold ratio inside one tariff; Quebec's 2026 schedule tops out at C$3,391/t for polystyrene, PVC and PLA; Colorado's dues run from 2¢/lb for aluminium to 81¢/lb for rigid PVC, with flat dues of $800–3,600 for producers under ten tons.
Two jurisdictions resist tabulation, informatively. Germany has no official rates by design — roughly ten dual systems negotiate licensing fees bilaterally with producers, so every published "German rate" is an estimate, and the estimates diverge by measurement: the research institute adelphi's 2025 study puts negotiated large-volume plastics rates around €640/t, while list-price and small-volume brokerage rates run near €1,200/t. Ontario publishes no public fee schedule at all: Circular Materials' rates sit behind a producer login, leaving North America's largest full-EPR market without a citable public price — a transparency gap flagged in Theme 2.
3. The spreads, and what the comparative studies make of them
The cross-European comparisons quantify a striking dispersion. The 2026 study produced for EUROPEN, the European packaging value-chain association, by CIRCPACK (a Veolia subsidiary — both interests noted) found EU-27 plastics fees ranging from €71/t in Greece to €1,640/t in Sweden — a 23-fold spread — with glass spanning 58-fold and steel wider still. The 2025 adelphi study (financed by nine German dual-system operators, its independence asserted and its funders' interests noted) documents the same order of dispersion and adds cost-efficiency rankings — recycling performance per euro of fee — on which Germany and Italy lead for plastics.
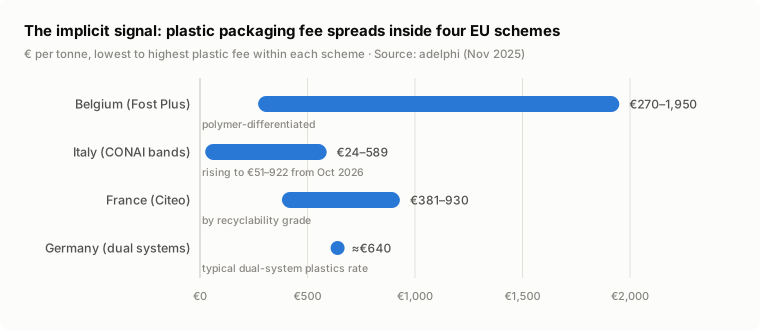
Why do fees differ this much? The comparative studies converge on a set of mechanical explanations, each of which doubles as a caution against naive comparison:
Scope and coverage differ. The UK's base fees cover only household packaging disposal costs paid to local authorities; Quebec's and Ontario's cover the full net cost of an operated system; France and Italy historically covered roughly 80% of system costs, so their fees understate what the system truly costs (the coverage discussion). A fee is the numerator of a fraction whose denominator — what it must pay for — varies by jurisdiction.
Deposit systems skim the base. Where a deposit-return system removes PET bottles and aluminium cans, the packaging fee is levied on what remains — heavier, dirtier, lower-revenue material — pushing the average per-tonne fee up. adelphi identifies this directly for Germany: the DRS strips out the valuable fractions, "driving up the average fee per ton" of the residual stream. High fees can therefore signal an efficient two-instrument system rather than an expensive one.
Cost structures genuinely differ — labour costs, collection density (Belgium's dense door-to-door network), landfill prices, and sorting infrastructure maturity all move the budget the fee must balance.
Structure differs. The EUROPEN/CIRCPACK headline — "fee structure, not fee level, drives recycling performance," with granular eco-modulated systems outperforming by 16.5 percentage points — should be read with the caveats set out in Theme 1 (the two-goal article): the correlation is cross-sectional, the outcome is recycling rates rather than design change, and the publisher has commercial interests in the countries analysed. But its negative finding is robust and matters here: no correlation between absolute fee level and performance. Expensive systems are not demonstrably better systems.
4. What fees amount to per item and per household
Set against product prices, the fees are small — which is a measured claim, not a talking point. The only study to price actual products across fee regimes (commissioned by Oregon's environment agency from the consultancy RRS, 2020) computed per-item fees in Canadian provinces at fractions of a cent to a few cents — its matched-price comparisons are examined in the pass-through article. Advocacy compilations on the pro-EPR side (the Natural Resources Council of Maine) put per-package fees at $0.001–0.059 across materials; the UK government's impact assessment implies roughly £48 per household per year at assumed pass-through; the Bank of England's estimate, as quoted by the retail sector, is that UK packaging fees could add "a little over ½%" to the level of food prices if fully passed through. Fees run at roughly 0.4–2% of product price — the arithmetic that anchors both the "small magnitude" and the "weak design signal" findings that recur throughout this library.
Per-household claims from program operators point the other way and should be read as advocacy in both directions: Circular Action Alliance told a Colorado legislative committee that many households will "save $100–$150 per year" as producer funding replaces subscription recycling; Washington's Ecology department projects household recycling bills falling "at least 90%" by 2032. Both are claims about the offset side of the ledger, whose delivery record is examined in the municipal-savings article.
5. Reading any fee schedule: five questions
- What must the fee pay for? Full net system cost, household disposal costs only, or enumerated elements — the largest source of cross-jurisdiction difference.
- What has the deposit system removed? A fee on the post-DRS residual stream is not comparable to a fee on the full stream.
- What is the material category structure? Belgium's nineteen plastic subcategories and the Netherlands' 78-fold internal spread price recyclability differences that a two-category schedule averages away.
- Is the rate public, and is the methodology? Germany's rates are private by market design; Ontario's by choice; the UK's are public with published methodology. The answer determines whether the fee can be checked at all.
- What moved since last year, and why? Because fees are budget residuals, a jump can reflect cost escalation, tonnage shortfall, revenue collapse, or reallocation between materials — and without a published reconciliation, outsiders cannot tell which (the transparency article).
6. Where the argument stands
Three conclusions organise the evidence. First, fee-setting is budget arithmetic, and fee levels are system-cost mirrors — they reveal what a jurisdiction's collection system costs and what share producers must carry, not what any material does to the environment. Second, the international spread is dominated by scope, structure and DRS interaction, not by efficiency differences — which is why the comparative studies find no fee-level/performance correlation, and why single-number comparisons ("fees in X are triple those in Y") are almost always scope errors. Third, the transparency gradient is the real finding of the comparison: the same exercise that produces a verified table for Belgium, the Netherlands, the UK, Quebec and Colorado produces estimates for France and Germany and nothing at all for Ontario — and a field whose central price is unpublishable in its largest North American market has a disclosure problem more consequential than any particular rate.
References
- Fost Plus, Green Dot rates 2026 (official tariff sheet); Verpact (Netherlands), 2025 and 2026 rates; PackUK 2025–26 confirmed base fees and Year 2 illustrative fees (GOV.UK, June and December 2025); Éco Entreprises Québec, 2026 fee schedule; Circular Action Alliance, Colorado 2026 dues schedule (October 2025) and California illustrative fees (May 2026). All examined directly.
- Circular Action Alliance, Oregon 2026 fee schedule — figures as reported in secondary analyses (Tax Foundation, May 2026, an anti-tax advocacy publisher; trade compilations); minor discrepancies between secondary readings noted and the primary schedule not fully parsed.
- Citeo tariff structure and 2026 approximate rates — as reported by French compliance consultancies; official tariff document not machine-readable in this pass. French rates are marked reported, not verified.
- adelphi (2025). Efficiency and Performance of Packaging EPR Systems in the EU — financed by nine German dual-system operators; independence asserted, interest disclosed. Fee estimates and cost-efficiency findings cited in Sections 2–3.
- EUROPEN (2026). EPR System Performance in the European Union, produced by CIRCPACK by Veolia — the 23-fold plastics spread and structure-over-level finding; interested-party evidence, identified as such.
- PRO Europe, Participation Costs Overview 2025 — supplementary European rates.
- RRS / EPI-Lorax for Oregon DEQ (2020), consumer price study — per-item fee calculations; Natural Resources Council of Maine, consumer-price talking points (2022) — advocacy compilation, identified as such; UK impact-assessment and Bank of England figures as reported by the British Retail Consortium (October 2025).
- Circular Action Alliance testimony to the Colorado House (February 2026); Washington Department of Ecology (July 2026) — operator and agency household-cost claims, identified as claims.
Verification note: the comparison table mixes verified primary schedules with reported figures, flagged per row; currency conversions are approximate and scope caveats are integral to the comparison, not footnotes to it. See Sources and method.