How are recycling rates measured — and can jurisdictions be compared?
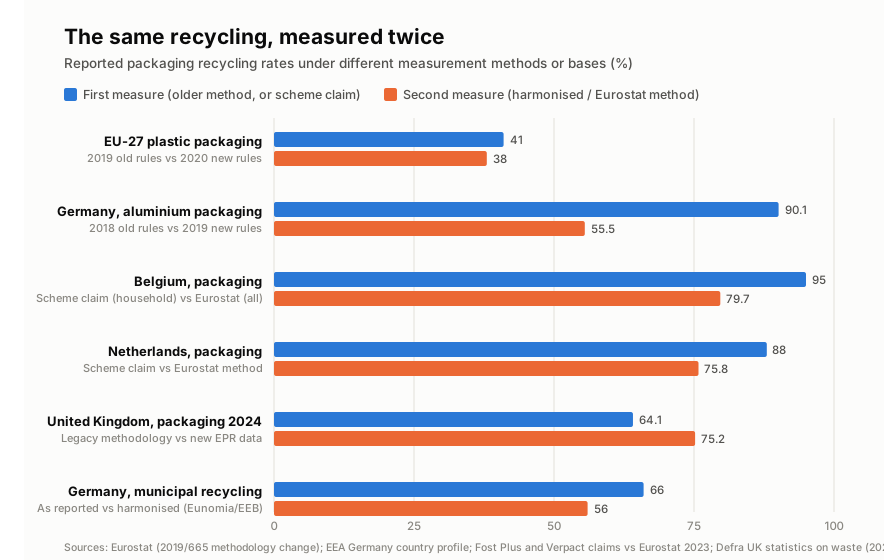
Every performance claim in packaging EPR rests on a recycling rate, and a recycling rate is not a fact of nature: it is a fraction whose numerator, denominator and point of measurement are all policy choices, made differently in every jurisdiction and changed over time within jurisdictions. The consequences are not marginal. The EU's 2019 methodology reform cut Germany's reported aluminium packaging rate from 90.1% to 55.5% with no physical change in German recycling; Belgium's scheme reports 95% while the harmonised European figure is 79.7%; the UK published two official 2024 rates eleven points apart, from two methodologies, in the same statistical release. This article — the centrepiece of this theme — dissects the anatomy of a recycling rate: the calculation-point problem and the EU's reform of it; the denominator problem of producer-reported supply; the definitional variance across Canada, the US and Europe; the export question; the harmonisation studies showing what happens when someone re-measures everyone consistently; and what a reader must check before believing any rate anywhere.
1. The anatomy of a rate
A recycling rate is (tonnes counted as recycled) ÷ (tonnes counted as generated or supplied). Every term conceals choices:
- Where along the chain is the numerator measured? Material can be counted at collection, after sorting, at bale sale, at the reprocessor's gate, or as reprocessed output — and 10–40% of collected material can disappear between the first point and the last.
- What is the denominator? Waste generated (estimated how?), packaging placed on the market (reported by whom?), or obligated supply (defined by which exemptions?).
- What is subtracted? Contamination, non-target material, moisture, residues — at which stage, by whose measurement?
- What is added? Exports (verified how?), incinerator-ash metals, repaired reusables?
Two systems answering these questions differently can report rates twenty points apart while performing identically. That is not a hypothetical, as the rest of this article documents.
2. The calculation point: the EU's reform and its quantified effects
The deepest of the choices is where recycling is deemed to happen, and the EU is the one jurisdiction to have reformed it explicitly — creating, in the process, the field's best natural demonstration of how much measurement matters.
Before 2020, EU member states measured packaging recycling at the output of sorting facilities: whatever left the sorter bound for reprocessing counted as recycled, losses downstream notwithstanding. Commission Implementing Decision (EU) 2019/665 (April 2019, applying from reference year 2020) moved the count to the calculation point: "the point where packaging waste materials enter the recycling operation whereby waste is reprocessed into products, materials or substances that are not waste." The annexes fix the point per material: sorted glass entering the furnace; sorted metals entering the smelter; sorted paper entering pulping; plastics as polymers or flakes entering pelletisation, extrusion or moulding without further processing; wood entering particleboard manufacture. Recycled amounts must exclude non-packaging material collected with the packaging and "residues from products that the packaging used to contain" — the yoghurt no longer counts with the pot.
The measured effects were immediate. The EU-27 plastic packaging rate fell from 41% (2019, old rules) to 38% (2020, new rules) — Eurostat itself attributing the "provisional decrease of 3 percentage points" to the stricter calculation point and composite accounting. Country-level effects were larger where prior practice had been most generous: Germany's reported aluminium packaging rate fell from 90.1% (2018) to 55.5% (2019) on adopting the new method — a 34.6-point drop with no change in any German smelter's intake — and its total packaging rate dropped across all streams, per the European Environment Agency's country profile. The reform's lesson generalises: the pre-2020 European record and the post-2020 record are different measurement systems, and time-series claims that span the break without adjustment are comparing incommensurable numbers.
3. The denominator: producer-reported supply and its known biases
The denominator of most packaging rates is "packaging placed on the market" — derived, in nearly every jurisdiction, from producer declarations. This imports the free-riding and under-reporting problems of Themes 2 and 4 directly into the performance statistics: every unregistered producer and under-declared tonne shrinks the denominator and inflates the reported rate. The system's integrity failures and its performance claims are arithmetically coupled, and in the flattering direction.
The bias is quantified in the academic literature. A hybrid input-output analysis by Ciprian Cimpan and colleagues (Journal of Industrial Ecology, 2021) estimated that EU plastic packaging waste generation "could have been up to 15% higher" than official statistics — enough to pull the official ~39% rate of its study year down to roughly 30% on a consistent basis. A 2023 methodological review by Somlai, Bullock and Gallagher (Waste Management & Research) documents the machinery of the gap: placed-on-market reporting "commonly underestimates waste generation" through irregular and incomplete reporting; de minimis registration thresholds vary across member states by three orders of magnitude (a cited range of 30,000 kg in Germany against 100 kg in Austria); and online-sales free-riding erodes the base further. The UK's National Audit Office put an enforcement floor under the phenomenon in 2018: at least 4.5% of obligated companies not registered. And the Netherlands supplies the sharpest national case: against official plastic rates above 50%, researchers at Wageningen University calculated a net recycling rate of 37–38% for the same system by deducting chain losses against placed-on-market tonnage — with a theoretical maximum of 72% given the packaging mix.
4. Definitional variance: five systems, five metrics
What "recycled" means differs across the jurisdictions this library covers, in ways that make the headline numbers non-comparable by construction:
| System | Numerator measured at | Denominator | Consequence |
|---|---|---|---|
| EU (post-2020) | Input to final recycling operation, impurities excluded | Packaging waste generated (≈ producer-reported POM) | The strictest numerator, on a soft denominator |
| US EPA | Materials-flow mass balance: material recovered for recycling, including exports, no downstream loss deduction | Generation (modelled) | Collection-basis rate; exports count sight-unseen |
| Recycle BC | Tonnes collected (net of receipt deductions) | Steward-reported obligated supply | A collection rate against an exemption-shaped denominator; reprocessing losses invisible |
| Ontario (legacy Datacall) | Marketed tonnes — sorted, processed and sold — residue counted as disposed | Estimated generation | Stricter than BC's numerator; different denominator again |
| UK (PRN/PERN) | PRNs issued at the accredited reprocessor's gate; PERNs issued at the point of export — before any overseas reprocessing | Producer-reported obligated tonnage | Domestic evidence at reprocessor input; export evidence at the dock |
The Canadian contrast deserves emphasis because it is routinely elided in national comparisons: British Columbia's celebrated ~80% is a collection rate against obligated supply, while Ontario's criticised ~57% was a marketed rate against estimated generation — a stricter numerator over a broader denominator. The systems' true performance gap, whatever it is, is not the headline gap. Quebec's 48% (material sent to recycling against municipally generated recyclables) is a third construction. Add the deposit-system boundary — beverage containers sit inside European packaging rates and largely outside Canadian curbside program rates, removing the highest-performing materials from the latter's numerators — and cross-jurisdiction league tables dissolve on inspection.
The measurement disputes inside jurisdictions follow the same logic. The 2020 external review of Recycle BC's reported performance (by Calvin Lakhan of York University) argued from the program's own filings that costs had risen ~26% (2015–18) against roughly one point of diversion gain, that recovery per capita peaked in 2015, and that nearly all the reported recovery improvement was compositional — increased glass tonnage — concluding the program sat in a 75–80% steady state; the program did not respond to the review's data requests, and no formal rebuttal was located for this library. Whatever one's reading of that exchange, its structural point stands independently: the reported rate could not adjudicate the dispute, because the rate's own construction was what was in dispute.
5. Exports: the offshore numerator
Exported material is where measurement and integrity problems converge, because the counting jurisdiction cannot observe the outcome.
The UK is the documented extreme: its National Audit Office found that exports accounted for half of all packaging tonnage reported as recycled in 2017 — evidenced by PERNs issued at the point of export, not after verified overseas reprocessing — with a sixfold export increase since 2002 while domestic recycling stayed flat, "some exported material... not recycled under equivalent standards" and instead landfilled or polluting, and a compliance-visit regime running at a third of its own targets. The EU's rules require "sound evidence" of broadly equivalent conditions abroad; the US mass-balance method historically counted exports as recycled without post-export verification — a practice central to the collapse of claimed US plastics rates once export destinations closed (advocacy recalculations put the US plastics recycling rate at 5–6% by 2021).
The academic quantification is stark: the EU Joint Research Centre-linked analysis by Antonopoulos, Faraca and Tonini (Waste Management, 2021) found the EU's actual end-of-life plastic packaging recycling rate in 2017 was 14% excluding exported material — versus 25% counting exports as recycled. Counting exports nearly doubled the apparent rate. The regulatory response is now in motion: the Basel plastic-waste amendments (2021) imposed prior-informed consent on contaminated exports, and the EU's new Waste Shipment Regulation bans non-hazardous plastic exports to non-OECD countries from November 2026 — a ban that will, among its other effects, stress-test every European rate that has leaned on the export numerator.
6. Re-measuring everyone consistently
What happens when a single team applies one methodology to everyone is the cleanest demonstration of the comparability problem. The Eunomia/European Environmental Bureau exercise (Recycling — Who Really Leads the World?) harmonised reported municipal rates for counting point, contamination, ash metals and scope: Germany's reported 66% fell to ~56%; Wales's 64% to 52%; the adjusted world ranking (Germany 56, Austria 54, South Korea 54) differed from the reported one in both levels and order. The EUROPEN/CIRCPACK 2026 study reached the structural version of the same conclusion for packaging: "the underlying measurement infrastructure — harmonised sorting analysis, standardised material identification, comparable measurement protocols — does not yet exist uniformly across the EU-27," and, strikingly, high-transparency systems in its sample reported 69.6% against 56.2% for low-transparency ones — a correlation readable either as transparency improving performance or as opacity enabling generous counting.
The institutional response is the PPWR's "recycled at scale" layer: from 2035, recyclability grading requires that a packaging category actually be "collected separately, sorted and recycled in installed infrastructure" at defined volume thresholds (55%; 30% for wood) — the EU legislating against its own history of recyclable-in-principle claims, and in doing so conceding this article's premise: what is counted, and where, has been doing much of the work that recycling was supposed to do.
7. What to check before believing any rate
Seven questions, in the order they most often change the answer:
- Where is the numerator measured — collection, sorting output, reprocessor input, or reprocessed output?
- What is the denominator — generation (estimated how?), placed-on-market (reported by whom, with which exemptions?), or obligated supply?
- Does the series cross a methodology break — the EU's 2020 change, the UK's dual 2024 methods (64.1% legacy versus 75.2% under new EPR data — an eleven-point gap in one official release), any program transition?
- Are deposit-system materials inside or outside the reported rate?
- How are exports counted, and against what verification?
- What was subtracted for contamination and residue, and at which stage — against measured contamination rates of 15–25% in current North American streams?
- Who reports the underlying data, and what is their interest — the scheme whose performance is being judged is, almost everywhere, the source of both numerator and denominator.
8. Where the argument stands
The measurement problem is not a technical footnote to EPR performance; on the assembled record it is close to the whole story of what the performance numbers mean. The same physical system can report 55% or 90% depending on counting choices (Germany's aluminium); the same country can hold two official rates eleven points apart (the UK); scheme claims and harmonised statistics diverge by ten to fifteen points wherever both exist (Belgium, the Netherlands); the denominator is supplied by the regulated parties and biased in the flattering direction; and half of some jurisdictions' "recycling" has historically been evidence issued at a dock. None of this establishes that reported progress is illusory — the EU's reform, the harmonisation studies and the PPWR's recycled-at-scale test are all evidence of a field tightening its own accounting. What it establishes is the reading rule this library applies throughout: a recycling rate is a claim about a measurement system before it is a claim about recycling, and comparative or causal arguments built on unexamined rates — including most of the ones circulating in EPR advocacy on all sides — inherit every choice documented above, usually without knowing it.
References
- Commission Implementing Decision (EU) 2019/665 (packaging waste data; the calculation-point and measurement-point definitions and material-specific annexes, quoted in Section 2); Eurostat, env_waspac metadata — the pre/post-2020 methodology descriptions. The companion Decision 2019/1004 governs municipal-waste data under the Waste Framework Directive; packaging rates cite 2019/665.
- Eurostat news releases (January 2021; October 2022; October 2024) — the 41%/38% plastic series and the attributed 3-point methodology effect; Eurostat Statistics Explained, packaging waste statistics.
- European Environment Agency, Germany country profile (early-warning series) — the 90.1%→55.5% aluminium change and the all-stream 2019 drop.
- Cimpan, C., Bjelle, E.L. & Strømman, A.H. (2021). "Plastic packaging flows in Europe: A hybrid input-output approach." Journal of Industrial Ecology — the 15% denominator underestimate.
- Somlai, R., Bullock, C. & Gallagher, J. (2023). "Plastic packaging waste in Europe: Addressing methodological challenges in recording and reporting." Waste Management & Research — de minimis variance and reporting biases.
- Brouwer, M. & Thoden van Velzen, E.U. (2020). "Technical Limits in Circularity for Plastic Packages." Sustainability 12(23) — the Dutch 37–38% net-rate recalculation and 72% theoretical maximum.
- National Audit Office (2018). The packaging recycling obligations — the export share, PERN mechanics, fraud-risk and enforcement findings; Defra, PRN/PERN reform consultation — the evidence-point definitions.
- Antonopoulos, I., Faraca, G. & Tonini, D. (2021). "Recycling of post-consumer plastic packaging waste in the EU." Waste Management 126 — the 14%/25% export effect and stage-loss findings.
- Lakhan, C. (2020). Review of Recycle BC Program Performance — the BC critique, characterised from the report and contemporaneous trade coverage (including the program's non-response to data requests); Recycle BC annual reports — the recovery series.
- RPRA, Datacall Report 2019 — the Ontario marketed-tonnes methodology and 57.3% rate; RECYC-QUÉBEC, Bilan 2023 — the Quebec basis.
- US EPA, Facts and Figures methodology documentation; stakeholder positions from the 2021 national-definition consultation; Beyond Plastics / Last Beach Cleanup (2022) — the 5–6% US plastics recalculation (advocacy source, identified as such).
- Eunomia / European Environmental Bureau, Recycling — Who Really Leads the World? — the harmonised re-rankings; EUROPEN/CIRCPACK (2026) — the measurement-infrastructure and transparency findings (interested-party study, identified as such).
- Regulation (EU) 2025/40 — the "recycled at scale" definition and thresholds; Regulation (EU) 2024/1157 — the non-OECD plastic export ban from November 2026.
- Defra, UK statistics on waste (2024 provisional) — the 64.1%/75.2% dual-methodology publication.
Verification note: methodology definitions are quoted from the implementing decision's text; quantified methodology effects are taken from Eurostat's and the EEA's own attributions; scheme-claim-versus-Eurostat divergences are presented with both figures and their differing bases stated. See Sources and method.