Who ultimately bears EPR costs? Pass-through and the consumer price evidence
Producers write the cheques; who bears the cost decides whether packaging EPR is "polluter pays" or a concealed consumption charge. This is among the most heavily contested questions in the field — it has decided legislative outcomes in the United States and shaped fee politics in Canada and the United Kingdom — and the state of knowledge is genuinely strange: the economic theory of cost pass-through is well developed, the evidence from analogous levies is rich, two natural experiments are running at this moment, and no jurisdiction anywhere has produced an ex-post causal study of what packaging EPR fees actually did to prices. Every household-cost figure in circulation is an assumption-driven calculation produced by a party with a position. This article assembles what theory and the measured analogues predict, inventories the one quasi-empirical study and the modelling war conducted around it, and specifies what would settle the question.
1. What economic theory predicts — and it predicts a lot
The pass-through question is not open theoretical terrain; it is a solved framework awaiting application to this instrument.
Industry-wide costs pass through at high rates. The canonical modern treatment is by the economists Glen Weyl and Michal Fabinger (Journal of Political Economy, 2013), who characterise pass-through in terms of demand and supply elasticities and market structure. The practical conclusion, drawn in the standard regulator's reference on the subject (a 2014 study by RBB Economics for the UK Competition and Markets Authority), is the one that matters for EPR: industry-wide cost changes pass through at high rates — often near 100% in competitive retail — while firm-specific costs pass through at far lower rates. EPR fees are industry-wide by construction: every obligated producer in a jurisdiction faces the same schedule. This single point embarrasses both camps at once. It undercuts the pro-EPR reassurance that "producers will absorb the fees," and it means the high pass-through assumptions used on the industry side of the modelling war are the theoretically defensible ones.
Per-unit levies can over-shift. EPR fees are per-tonne and material-specific — economically an excise, not an ad valorem tax. The excise literature (Sofia Delipalla and Michael Keen's 1992 analysis in the Journal of Public Economics; the European cigarette-tax empirics) shows that specific taxes under imperfect competition are prone to over-shifting: pass-through above 100%.
Pass-through is asymmetric. Prices rise more readily on cost increases than they fall on decreases — the work of Youssef Benzarti and co-authors on European VAT changes found consumer prices responding roughly twice as strongly to increases as to cuts. The testable implication: when fees fall — as several UK Year 1 fees came in below their illustrative levels — symmetric price declines should not be expected. "Fees will fall as the system matures" is weaker consumer reassurance than it sounds.
Salience shapes everything. Raj Chetty, Adam Looney and Kory Kroft (American Economic Review, 2009) established that consumers under-react to non-salient charges. An EPR fee embedded in the shelf price is maximally non-salient — so demand resistance to pass-through is minimal (supporting high pass-through), and the consumer behavioural response is nil, which is why the design intent routes all incentive force to producers via fee modulation. This is the economics beneath the fights over visible fee display (the fee-or-tax article).
Chain pricing smears state costs nationally. Large US retailers price uniformly across regions, so a state-level EPR cost is partially spread across a chain's national footprint — Washington's Ecology department invokes exactly this in predicting no in-state shelf impact. It cuts both ways: in-state consumers bear less than full incidence, and consumers in non-EPR states subsidise them. Nobody has modelled the interstate transfer.
One more piece of theory belongs on the record because it reframes the debate's moral register: in the welfare-economics tradition from which EPR's upstream design descends (Theme 1), the producer-level charge is supposed to appear in consumer prices — that is how end-of-life costs enter consumption choices. Within the theory, "EPR fees raise prices" is a description of the instrument working. The honest debate is about magnitude and distribution, not about whether pass-through is a scandal.
2. What has actually been measured
Very little, and the inventory is short enough to give in full.
The one quasi-empirical study. The only direct price study of packaging EPR anywhere was commissioned by Oregon's Department of Environmental Quality from the consultancy RRS in 2020 — before any US program existed. It compared 118 matched product prices across Canadian provinces with EPR (British Columbia, Manitoba, Quebec) and without (Alberta, Saskatchewan, Nova Scotia). Its findings sit awkwardly with everyone's talking points: 76% of matched prices were identical; where prices differed, they were more often higher in the non-EPR provinces; the mean difference was $0.0056 per item; fees amounted to 0.44–0.74% of product price; and the correlation between fee size and price difference was essentially zero (R² ≈ 0.04) — a mouthwash bottle carrying a five-cent fee in BC and a two-cent fee in Quebec showed price differences unrelated to the gap. The study is a snapshot with acknowledged confounds, not causal identification, and it predates the 2024–26 fee escalation; it is nonetheless the closest thing to measurement the field possesses, and both sides' treatment of it is diagnostic — the pro-EPR side cites it as proof of no effect (more than it shows), the industry side ignores it (more than it deserves).
The econometric anchor. Eugénie Joltreau's 2022 study in Environmental and Resource Economics — the broadest evaluation of European EPR fees, examined in Theme 1 — bears on incidence indirectly: she finds fee costs largely absorbed or passed through without behavioural response, notes that pass-through "may be incomplete and averaged across" products, and simulates per-item fee magnitudes at fractions of a cent to a few cents. Small, smeared and silent is the econometric picture of the legacy fee era.
The measured analogues. Sugar-sweetened-beverage taxes — the closest studied per-unit levy on packaged consumables — pass through at roughly 70–80% pooled across US natural experiments, with Berkeley lower (chain pricing dampened local pass-through) and Philadelphia near-complete. Tobacco and alcohol excises pass through fully and frequently over-shift. Broad VAT changes pass through near-fully; targeted ones weakly; all asymmetrically. None of these is packaging EPR; together they bracket what serious estimation would likely find.
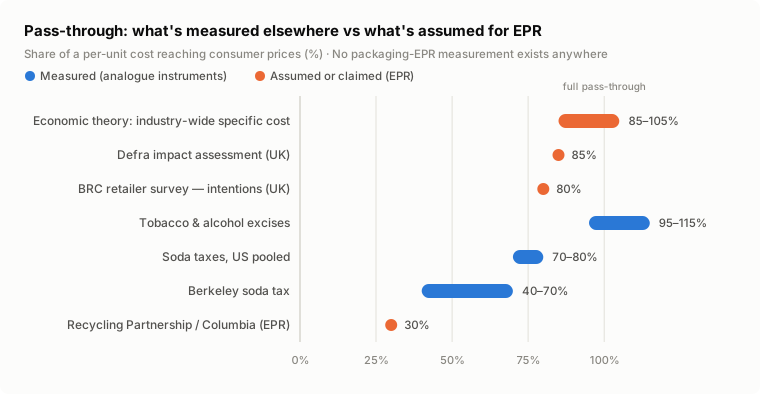
The running natural experiments have produced nothing yet. For the UK (fees invoiced from October 2025), no measured price decomposition exists; the anchors are modelled — the government's impact assessment assumes 85% pass-through, implying roughly £48 per household per year, and the Bank of England put the potential contribution at "a little over ½%" on the level of food prices if fully passed through. The British Retail Consortium's October 2025 survey measured intentions, not prices: over 80% of retailers planned to pass on the majority of costs. For Oregon (fees from July 2025), the first-year program report is silent on prices and no independent analysis has surfaced. That silence — two live experiments, no study — is the field's single most consequential evidence gap.
3. The modelling war
With no ex-post measurement, the public debate runs on ex-ante models, and the inventory is best organised by side, with methods and sponsors attached.
The cost-side modelling. The most widely circulated US estimates come from modelling by Calvin Lakhan of York University's Circular Innovation Hub, released through business associations opposing the bills in question. The New York study (March 2025, released by the Business Council of New York State) estimated direct producer costs of roughly $1.3 billion annually, translating to $38–61 per month for a family of four and price increases of 4–7% on packaged goods; a parallel New Jersey study (via the state Chamber of Commerce) put the figure at $29–46 per month. The method: Canadian per-tonne fees (Manitoba, Ontario, BC) applied to state tonnage as proxies, an assumed 80% pass-through, and an economic multiplier converting direct costs to total impact — the multiplier being what separates the headline "total impact" figures from the fee arithmetic. A separate 2026 study by the same author for the American Consumer Institute modelled the cost of forced material substitution away from plastics (a 49-item basket rising 21.6%) — an analysis of substitution mandates, not of EPR fees, though frequently cited as if it were the latter. The American Forest & Paper Association circulates parallel figures ($330 per California family; up to $732 annually in New York), and anti-tax advocacy amplifies them. Methodological observations that apply across this family: the 80% pass-through assumption is defensible on the theory (Section 1); the Canadian fee proxies predate several fee escalations and scope differences; and the multiplier-based "total impact" figures measure modelled economic activity, not household grocery bills, though they circulate as the latter.
The counter-modelling. The pro-EPR side's central figure is a claimed ~30% pass-through from a Columbia University analysis funded by The Recycling Partnership (an industry-funded pro-EPR nonprofit), which also reports packaging at roughly 2% of product cost and the compliance-cost/price link as "weak at best" — a study whose primary document and peer-review status this library could not locate, and whose 30% figure sits in tension with the industry-wide-shock theory of Section 1. State agencies weigh in on the same side: Washington Ecology states there is "no expected impact on the cost of items at the store," citing the Oregon DEQ study and chain pricing; CalRecycle's regulatory impact assessment projects $21 billion in costs against $53 billion in benefits over ten years, with the state finance department noting drily that costs will be "borne by both businesses and households (through higher costs for many affected items)." The Product Stewardship Institute asserts "no systemic cost increase" from 35 years of European experience.
In Canada, the most-circulated figures are from Sylvain Charlebois of Dalhousie University's Agri-Food Analytics Lab (May 2026): EPR "may now be contributing roughly 0.3 to 0.8 percentage points to grocery inflation," and 1–1.5% in packaging-intensive categories — published with no disclosed methodology or data, widely syndicated, and adopted into federal political messaging as a "hidden food tax." No producer organisation or government has published a methodological rebuttal — an asymmetry between viral specificity and generic counter-messaging that is itself a finding about the field's communication failure.
The structural observation that organises the whole war: the two sides mostly do not contradict each other's numbers — they choose different sides of the ledger and different framings of the same money. The theory stack sits closer to the industry side on the pass-through rate (high, not 30%) and closer to the pro-EPR side on magnitude (fees at 0.4–2% of price cannot produce hundreds of dollars of monthly grocery impact through the fee channel alone). "Consumers pay for it" and "prices barely move" are simultaneously true, which is why the framing war never resolves.
4. Where cost claims decided outcomes
New York is the flagship case: packaging EPR passed the state Senate and died in the Assembly in both 2025 and 2026, amid duelling figures from roughly $48 per household per year (proponents) to $600 (opponents, a figure including modelled lost economic activity, not just fees). Washington passed its law against identical arguments and now runs active counter-messaging. Ontario's cost framing helped drive the 2025 target rollback (Theme 2). The UK government conceded the mechanism twice — delaying fees a year in 2023 explicitly to minimise "further pressure on food inflation," and its central bank now includes packaging fees in inflation commentary. Cost incidence is not an academic sideline; it is currently the operative political constraint on the instrument.
5. What would settle it
Two studies, both feasible now. First, an event study of a launch: scanner price data, product categories graded by packaging-fee intensity as the treatment gradient, neighbouring-market controls. Ontario's completed transition (January 2026) offers a near-ideal design — hard switch date, large market, adjacent provinces; the UK's window is smeared by anticipatory pricing (suppliers reportedly moved prices in early 2025, before invoices landed). Second, a net-incidence accounting for one jurisdiction: an estimated pass-through rate, municipal budget tracing, and distributional weighting from household expenditure data — every component standard, none assembled, because the parties with data access have clients and the parties without clients lack data.
Until one exists, the defensible position for any reader: pass-through is probably high (the theory and every analogue point that way); the magnitude is small (fees are sub-1% of grocery spend, and the per-item measurements are cents); the distributional net is unknown (the regressivity article); the offsetting savings have never been shown to reach households (the municipal-savings article); and every specific figure in circulation was produced by someone with a stake — a description that applies to both sides of this debate without exception.
References
Theory
- Weyl, E.G. & Fabinger, M. (2013). "Pass-Through as an Economic Tool." Journal of Political Economy 121(3).
- RBB Economics (2014). Cost Pass-Through: Theory, Measurement, and Potential Policy Implications. Report for the UK Competition and Markets Authority.
- Delipalla, S. & Keen, M. (1992). "The comparison between ad valorem and specific taxation under imperfect competition." Journal of Public Economics 49(3).
- Benzarti, Y., Carloni, D., Harju, J. & Kosonen, T. — asymmetric pass-through of VAT changes (NBER Working Paper 23849).
- Chetty, R., Looney, A. & Kroft, K. (2009). "Salience and Taxation." American Economic Review 99(4).
Measurement and analogues
- RRS / EPI-Lorax for Oregon DEQ (2020, rev. 2021). Consumer price study across Canadian EPR and non-EPR provinces — the findings quoted in Section 2, from the primary document.
- Joltreau, E. (2022). Environmental and Resource Economics 83(3), 527–578.
- US soda-tax pass-through literature (pooled natural-experiment estimates; Berkeley and Philadelphia studies); tobacco and alcohol excise pass-through literature; IMF work on VAT pass-through.
The modelling war (all advocacy or advocacy-released; interests as stated in text)
- Lakhan, C. (2025). Modeling direct and total economic impacts resulting from the adoption of Extended Producer Responsibility in New York State. Circular Innovation Hub, York University; released by the Business Council of New York State. Parallel New Jersey study via the New Jersey Chamber of Commerce (2025). Material Substitution Costing Analysis (2026), commissioned by the American Consumer Institute — a substitution-mandate analysis, distinct from fee incidence.
- American Forest & Paper Association cost claims (2026); Americans for Tax Reform commentary (July 2026).
- Columbia University analysis funded by The Recycling Partnership — the ~30% pass-through claim; primary document not located, status unverified.
- Washington Department of Ecology (July 2026); CalRecycle Standardized Regulatory Impact Assessment and California Department of Finance comment letter (2024–25); Product Stewardship Institute cost-impacts materials.
- Charlebois, S. / Agri-Food Analytics Lab (May 2026) — the Canadian grocery-inflation claims; no methodology disclosed.
- British Retail Consortium (October 2025) — retailer pass-through intentions and the Bank of England food-price figure as quoted therein; UK government impact assessment (85% assumption, ~£48/household).
Verification note: this article maintains the library's rule that modelled figures are identified with their assumptions and sponsors, on all sides; the absence of any ex-post causal price study anywhere is the article's central verified finding. See Sources and method.